GeoCAT encourages contributions to Python plot open development initiatives
CISL’s Visualization and Analysis Software Team (VAST) has rolled out an extensive and still growing gallery of plotting examples to help geoscientists analyze and visualize data in the Python ecosystem. With NCAR Command Language (NCL) going into maintenance mode in January 2019, VAST’s GeoCAT team began converting dozens of NCL plots to Python, and creating new plots, with the help of two SIParCS students. Now the team is reaching out to other contributors.
“We’re encouraging contributions from the scientific community by conducting this work as an open development effort,” said John Clyne, VAST section head. “The genesis was to help NCL users transition to using Python, but these plotting examples and scripts can help other geoscientists with no NCL experience.”
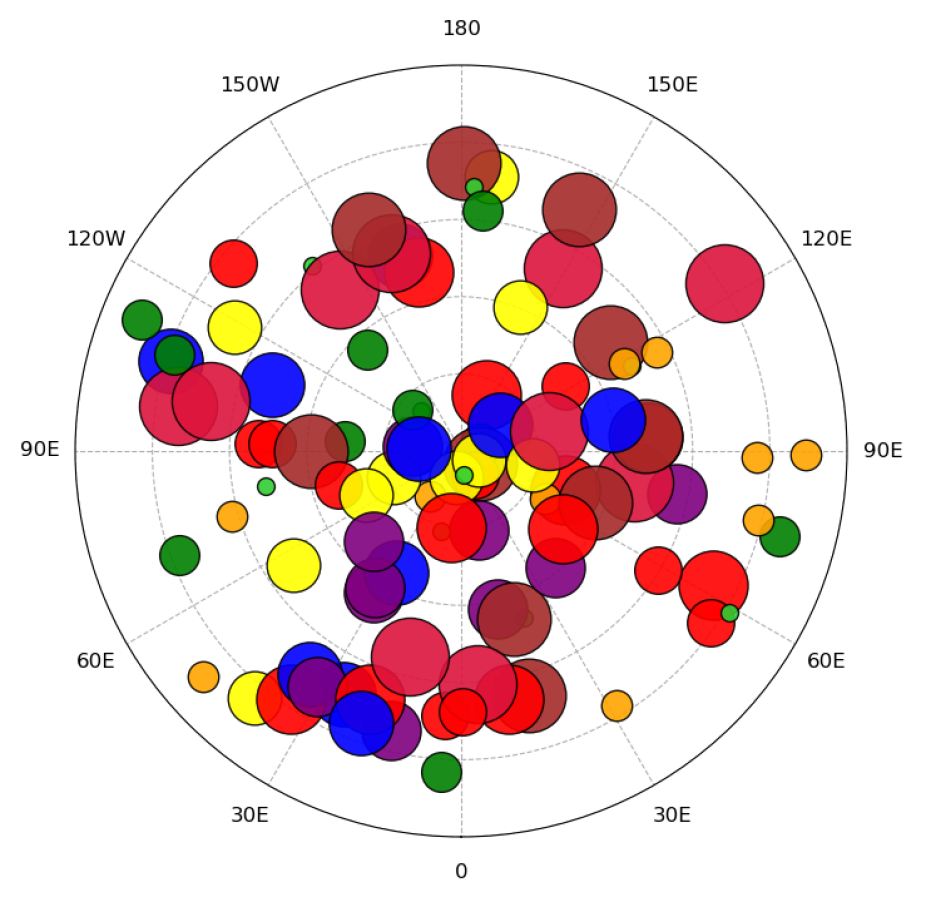
A scatter plot created using the NCL_scatter_6.py script illustrates several concepts, such as the use of markers of different colors and sizes and drawing filled, outlined markers on a polar map.
The GeoCAT examples gallery now provides more than 70 plots and scripts. Users can download the Python source code or Jupyter notebooks and customize them for analyzing and visualizing their own data.
Clyne said the gallery will continue to grow in response to what the scientific community needs and as external contributors respond to GeoCAT outreach efforts. It will also be used with other training resources in a recently funded NSF EarthCube project resulting from a UCAR/NCAR collaboration with SUNY at Albany.
The 2020 SIParCS students who worked as partners on the GeoCAT plotting effort talked about their experience in their final presentations and have since submitted an abstract for a presentation at the American Meteorological Society’s annual meeting in January. Recordings of their presentations can be found here:
- Rose Craker from Purdue University (and now a VAST student assistant)
- Claire Fiorino, San Diego State University